Methods for a fair comparison
To make a meaningful comparison between countries, two points are crucial.
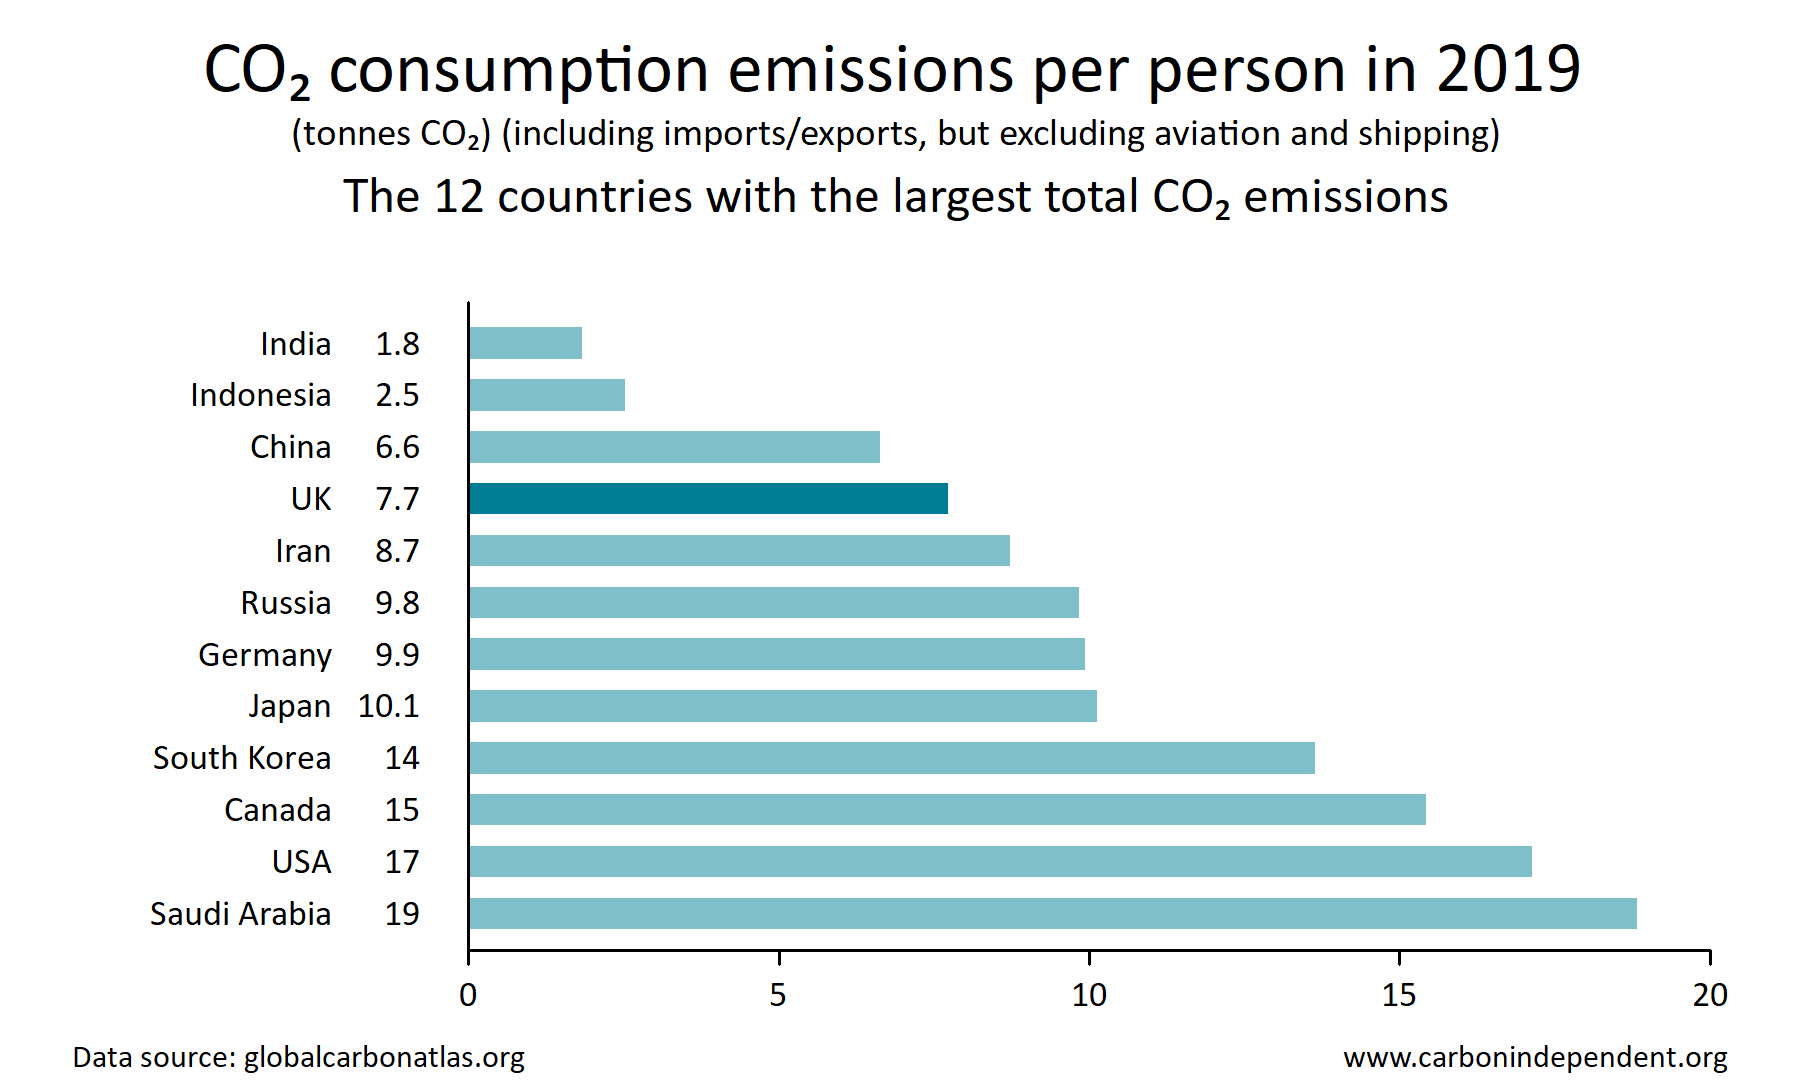
- The comparison must be of emissions per person. Little information is obtained from comparing the total emissions for whole countries since the largest countries have the biggest totals.
- All relevant emissions must be included, including emissions produced in the manufacture of goods that have been imported.
Two summary charts and some examples are given below.
Once allowance is made for population size and imports/exports, it is clear that it is wrong to pick out China and India for censure.
Summary charts
 This chart is free of copyright restrictions.
 World CO2 emissions
The total was about 36 billion tonnnes CO
2 in 2019 [1].
As the world population is 7.9.billion, this is 4.6 tonnes CO
2 per person per year.
UK greenhouse gas emissions
The total of greenhouse gas emissions was around 750 million tonnes CO
2-e per year in 2022, including imports/exports but excluding aviation [2].
As the population is 66 million, this is 11 tonnes CO
2-e per person per year (excluding aviation).
Adding emissions from aviation [3], the total is around 12 tonnes CO
2-e per person per year.
For CO
2 emissions alone, the UK's emissions are about 9 tonnes per person per year, including aviation [4].
China CO2 emissions
Emissions were 10.1 billion tonnes CO
2 in 2018 [5].
Of these, around 13% were from net exports, based on 2014 figures [6].
This gives an adjusted value of 8.8 billion tonnes CO
2.
As the population is 1.43 billion, this is 6.2 tonnes CO
2 per person per year.
USA CO2 emissions
Emissions were 5.42 billion tonnes CO
2 in 2018 [5].
The net CO
2 transfers associated with trade were 6% (net imports), based on 2014 figures [6].
This gives an adjusted value of 5.8 billion tonnes CO
2.
As the population is 327 million, this is 17.6 tonnes CO
2 per person per year.
India CO2 emissions
Emissions were 2.65 billion tonnes CO
2 in 2018 [5].
Of these, around 9% were from net exports, based on 2014 figures [6].
This gives an adjusted value of 2.41 billion tonnes CO
2.
As the population is 1.35 billion, this is 1.8 tonnes CO
2 per person per year.
Mozambique CO2 emissions
Emissions were 8.3 million tonnes CO
2 in 2018 [5].
As the population is 29 million, this is 0.3 tonnes CO
2 per person per year.
References
0

 ✖
✖